Scenario 1: Failure of Negotiations
Context
Negotiations break down. Countries prefer to emphasize their national interests. The USA abandon their climate policy objectives blocked in Congress. Canada, Australia and Japan eventually join the USA position. Only EU meets its commitments of -20% in 2020. However, in 2020, proven global warming revives the negotiations. The USA, Japan, Canada and Australia decide to reach -20% in 2030 (relative to 2005). The rest of the World does not commit.
As regards the European carbon market (valid in GEMINI-E3 only), it is assumed that, within the EU, a market of emission permits is introduced at national level to arrive at a single CO2 price for non-ETS sectors. Two CO2 prices coexist for an ETS sector and another for non-ETS sectors. The price of the ETS would be equal to 32 € in 2020 and 73 € for the non-ETS. Starting from 2021 the adoption by the other industrialized countries of GHG emissions abatement policy and the establishment within those countries of a market of emission permits reduces the international price to 28 € in 2025 which then rises to 83 € in 2030.
In order to evaluate the consequences of the failure of the COP-15 negociations on the long-term climate policies, the modeling of this scenario with TIAM also assumes the implementation of a World climate agreement after 2030 to satisfy a long-term climate constraint corresponding to a maximal long-term temperature increase of 2 degrees C.
Climate
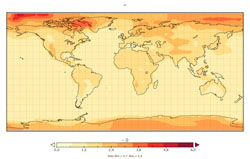
Please note that results below from GENIE are relative to 2005. In average, the temperature change relative to pre-industrial is 0.76 degrees higher.
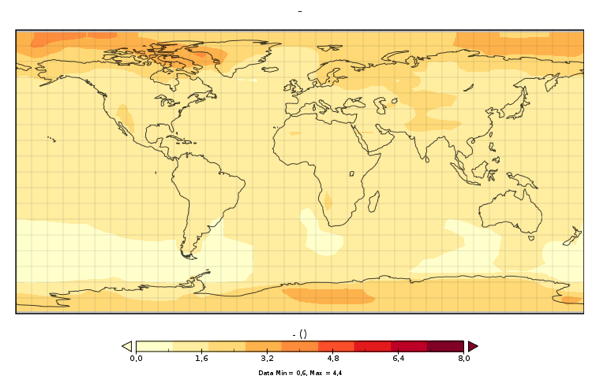
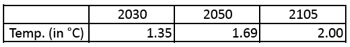
+ SAT warming average in 2105 relative to 2005
+ SAT warming standard deviation in 2105 relative to 2005
+ SAT warming average in 2050 relative to 2005
+ SAT warming average in 2030 relative to 2005
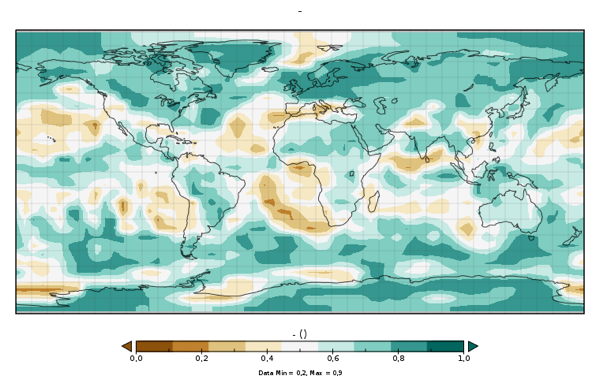
+ Probability of a precipitation increase (in %)
Economy
Click on each of the following links to see the corresponding figure.
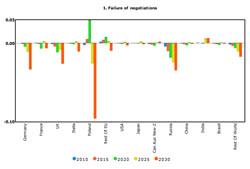
+ Surplus in percentage of Household consumption
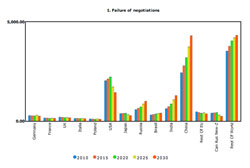
+ Emissions permit sales in Million Tons of Carbon per country until 2030
+ CO2 Price in euros per Ton of CO2 (2005 Euros)
+ Cost of the strategy: Cost of the strategy (as a % of the GDP): expressed as the net present value (NPV) of the loss of surplus over the century between the policy scenario and the reference case, divided by the NPV of the reference cumulative GDP over the 21st century. 2.8%
Emissions
+ GHG emissions in Million Tons of Carbon per country until 2030
+ Emissions of CO2, CH4 and N2O in GtC until 2105
Energy / Technology
+ Cumulative sequestrated carbon in geological sinks: 416 GtC
+ Primary energy (assuming FEQ=1 for non fossil energy) in EJ
+ Electricity generation in billions of kWh
+ Energy consumption by end-use sectors, including non-energy purposes in EJ
More detailed results in the Energy - Technology technical note.