Scenario 5: International Agreement (World)
Context
Same as policy scenario 4 but with all countries agreeing to act. From 2020, the Rest of
the World obtains a quota equal to 120% of their 2005 emissions. China, India
and Brazil and the Rest of the World participate to the international carbon
market. A restriction is imposed on the volume of permits they can sell during
the first years (10% of their quotas), this restriction is gradually removed
and trade is unlimited in 2030.
In order to evaluate the consequences of this
climate agreement on the long-term climate policies, the modelling of this
scenario with TIAM also assumes the implementation of a World climate agreement
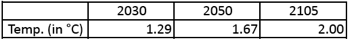
after 2030 to satisfy a long-term climate constraint corresponding to a maximal
long-term temperature increase of 2°C.
Climate
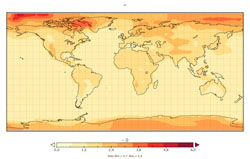
The patterns of expected change are broadly similar to those predicted for baseline emissions, but at lower amplitude. Warming predicted by GENIE is higher than the constraint applied to the economic models, as a result of the higher average climate sensitivity of the GENIE ensemble compared to the embedded climate representation in the economic models. Further simulations will be presented in due course in which the climate parameters in TIAM have been recalibrated to give closer agreement with the average predictions from GENIE. Nevertheless, whatever the average prediction from the climate model, the estimated uncertainty shows that actual temperatures could be either higher or lower than the average prediction, and that changes, and uncertainties, vary regionally.
Please note that results below from GENIE are relative to 2005. In average, the temperature change relative to pre-industrial is 0.76 degrees higher.
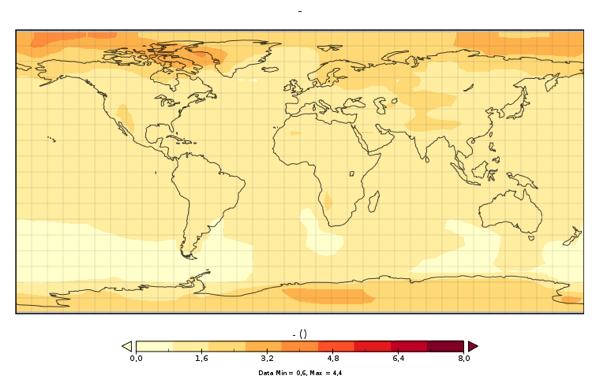
+ SAT warming average in 2105 relative to 2005
+ SAT warming standard deviation in 2105 relative to 2005
+ SAT warming average in 2050 relative to 2005
+ SAT warming average in 2030 relative to 2005
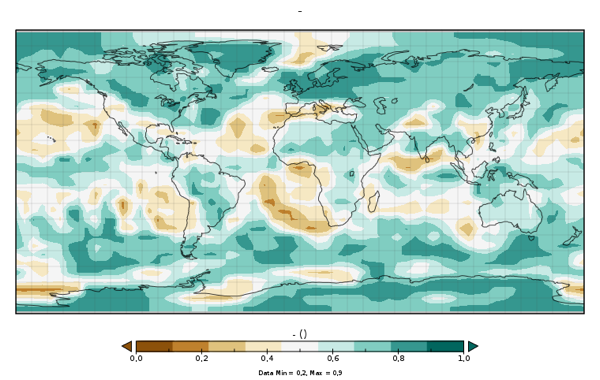
+ Probability of a precipitation increase (in %)
Economy
+ Surplus in percentage of Household consumption
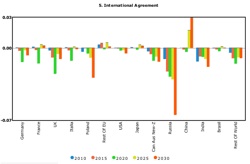
+ Emissions permits sale in Million Tons of Carbon per country until 2030
+ CO2 Price in euros per Ton of CO2 (2005 Euros)
+ Cost of the strategy: Net present value (NPV) of the cost of the strategy given as a % of the NPV of the GDP cumulated over the century: 2.5%
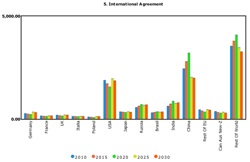
Emissions
+ GHG emissions in Million Tons of Carbon per country until 2030
+ Emissions of CO2, CH4 and N2O in GtC until 2105
Energy / Technology
+ Cumulative sequestrated carbon in geological sinks: 416 GtC
+ Primary energy (assuming FEQ=1 for non fossil energy) in EJ
+ Electricity generation in billions of kWh
+ Energy consumption by end-use sectors, including non-energy purposes in EJ
More detailed results in the Energy - Technology technical note.