Scenario 9: CPH High Forever
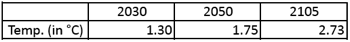
Context
The scenario represents the "advanced" version of the Copenhagen Accord, based on the strictest pledges proposed by the countries. For example, EU reduces it emissions only by 30% compared to 1990. These pledges are assumed to be maintained forever.
Climate
Please note that results below from GENIE are relative to 2005. In average, the temperature change relative to pre-industrial is 0.76 degrees higher.
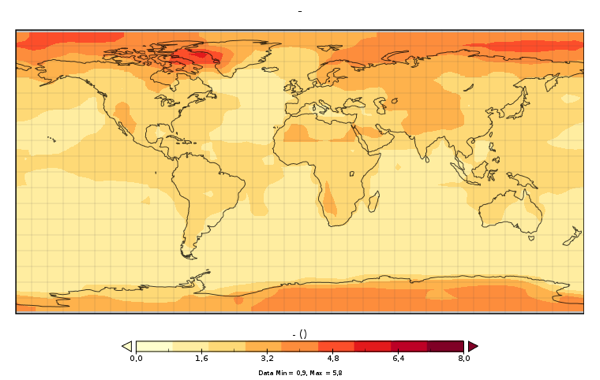
+ SAT warming average in 2105 relative to 2005
+ SAT warming standard deviation in 2105 relative to 2005
+ SAT warming average in 2050 relative to 2005
+ SAT warming average in 2030 relative to 2005
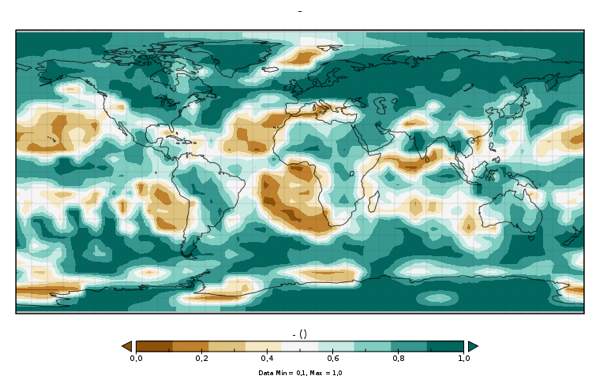
+ Probability of a precipitation increase (in %)
Techno-economy analysis (long term)
This scenario, as
well as scenario 8: CPH Low Forever, aim to emphasize the consequences of the pledges
of the Copenhagen Accord, assuming they are maintained over the century. The
combination of these scenarios with long-term climate targets, as described
below, completes the analysis by evaluating if these pledges keep the door open
for deeper emission cuts so that the long-term temperature increase remains
below 2°C.
The higher pledges allow an absolute reduction of CO2 emissions
(stabilisation to 2005 until 2030, and decrease of around 10% by the end of the
century). CO2 prices vary amongst countries from 50 to 280 $2000/tCO2 at the end of the century; the range is similar to the range observed with the
lower pledges; however, high prices are observed in more regions, including for
example USA, Russia. This reflects the difficulty in complying with the targets
imposed to these regions, given the expected increase of emissions in these
countries, the available mitigation options and the limited trade of permits
allowed between countries.
The main changes of the energy system follow the same trends as scenario
8: CPH Low Forever, but in an accelerated manner:
- In the electricity generation, changes occur 10 years earlier.
- In the end-use sectors, changes occur earlier but are also deeper; for example, final consumption of coal is reduced by more than 70% at the end of the century, compared to 55% with the lower pledges, with respect to the Reference case; the use of gas more than doubles, compared to an increase of 80% with the lower pledges, with respect to the Reference case.
- As in the case with lower pledges, higher pledges don't result in an electrification of the end-use sectors.
+ Combination with a long-term climate target: In order to evaluate what must be done after 2030 to keep the long term temperature increase below 2°C, it is assumed that these pledges as proposed by the Copenhagen Accord remain until 2040, without anticipation by the countries of more strict targets in the long term. Then, an international treaty involving the perfect cooperation of all countries is found and applied from 2040: all countries cooperate and mitigation efforts are done where they are more efficient. In other words, a first-best policy is applied from 2040. In this case, the 2°C cannot be respected, given the mitigation options available in the model. In other words, more efforts than the Copenhagen Accord are obviously required in a long-term horizon to limit the temperature increase to 2°C. The smallest feasible temperature increase would be around 2.15-2.20 °C. In other words, even the strictest pledges of the Copenhagen Accord must be immediately followed by deeper reductions in order to succeed in limiting the long-term temperature to 2°C. Waiting until 2040 before implementing a full international agreement, even if the Copenhagen Accord is respected until 2040, is too late.
+ Cost of the strategy: Net present value (NPV) of the cost of the strategy given as a % of the NPV of the GDP cumulated over the century: 0.514%
Emissions
+ Emissions of CO2, CH4 and N2O in GtC until 2105
Energy / Technology
+ Cumulative sequestrated carbon in geological sinks: 313 GtC
+ Primary energy (assuming FEQ=1 for non fossil energy) in EJ
+ Electricity generation in billions of kWh
+ Energy consumption by end-use sectors, including non-energy purposes in EJ