Scenario 4: Agreement within G20
Context
Industrialized countries + China + India + Brazil, agreed to set up from 2020 an international market for emission permits. From 2020, China and India are allocated quota as 150% of their 2005 emissions, and Brazil 120%. For industrialized countries, quotas are equal to objectives consistent with their goals for 2050, the European Union deciding to -30% in 2020 given the participation of China, India and Brazil to the agreement. China, India and Brazil participate to the International carbon market. A restriction is imposed on the volume of permits they can sell during the first years (10% of their quotas), this restriction is gradually removed and trade is unlimited in 2030.
In order to evaluate the consequences of the failure of the COP-15 negociations on the long-term climate policies, the modeling of this scenario with TIAM also assumes the implementation of a World climate agreement after 2030 to satisfy a long-term climate constraint corresponding to a maximal long-term temperature increase of 2 degrees C.
Climate
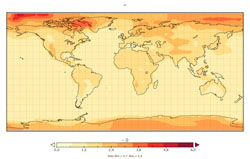
Please note that results below from GENIE are relative to 2005. In average, the temperature change relative to pre-industrial is 0.76 degrees higher.
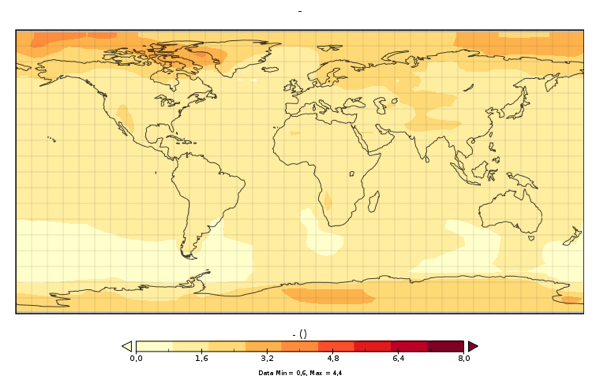
+ SAT warming average in 2105 relative to 2005
+ SAT warming standard deviation in 2105 relative to 2005
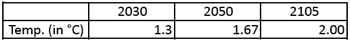
+ SAT warming average in 2050 relative to 2005
+ SAT warming average in 2030 relative to 2005
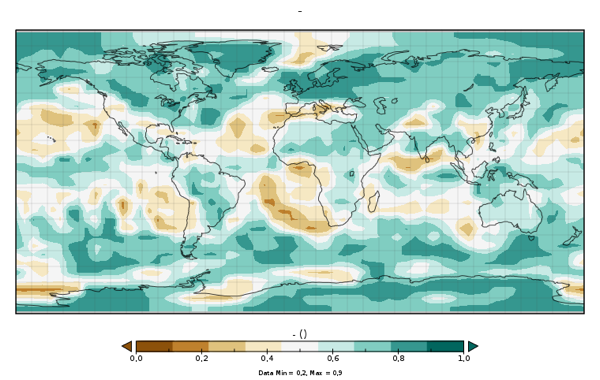
+ Probability of a precipitation increase (in %)
Economy
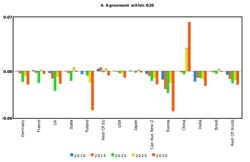
+ Surplus in percentage of Household consumption
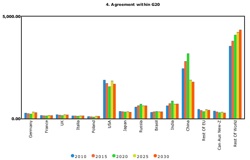
+ Emissions permits sale in Million Tons of Carbon per country until 2030
+ CO2 Price in euros per Ton of CO2 (2005 Euros)
+ Cost of the strategy: Net present value (NPV) of the cost of the strategy given as a % of the NPV of the GDP cumulated over the century: 2.6%
Emissions
+ GHG emissions in Million Tons of Carbon per country until 2030
+ Emissions of CO2, CH4 and N2O in GtC until 2105
Energy / Technology
+ Cumulative sequestrated carbon in geological sinks: 419 GtC
+ Primary energy (assuming FEQ=1 for non fossil energy) in EJ
+ Electricity generation in billions of kWh
+ Energy consumption by end-use sectors, including non-energy purposes in EJ
More detailed results in the Energy - Technology technical note.