Baseline Scenario
How to build the reference scenario
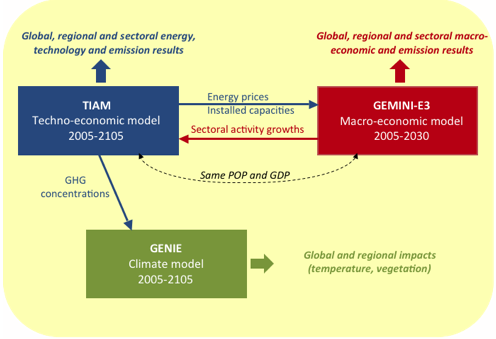
The reference scenario, also called business as usual (BAU), corresponds to a situation where no climate change policy is deemed necessary. As for the other scenarios, it is assessed through the combined use of the three models: TIAM - GEMINI-E3 - GENIE. The result is a representation of technology, economy and climate which is harmonized and consistent across the three models. The procedure adopted is illustrated in Figure 1 and described below.
Using
demographic trends for 2100 (based on United Nations data) and
assumptions on labour productivity, (....) one determines a scenario of
the evolution of the Gross Domestic Product (GDP) of world economies
for the 21st century. These assumptions of population and GDP are
introduced into the TIAM and GEMINI-E3 models, and a linkage is
established between these two models. Firstly, TIAM provides GEMINI-E3
with energy prices, given its description of efficient use of resources
and energy technologies to meet energy service needs. In return,
GEMINI-E3 provides TIAM
with a sectoral disaggregation of GDP growth over the period 2005-2030.
This information is extrapolated over the period 2030-2100 to be used
byTIAM as drivers for useful energy demands. The results of both
models, such as GHG
emissions, are then compared and discrepancies are analyzed in order to
identify where there is a need for harmonization of [some other
parameters in] the models. This applies to the number of installed
nuclear power plants, which is influenced by socio-political
factors that are often more important than economic efficiency alone.
We ensure that the development of nuclear capabilities of different
countries is harmonized between the two models. The
objective of this work does not lead to complete harmonization. It is
obviously impossible to harmonize two models whose structures and basic
principles are different. We content ourselves with ensuring that the
model assumptions are common and consistent. This guarantees similar
global GHG emissions in the two models.
Once the process of harmonization between TIAM and GEMINI-E3
has been performed, concentrations of GHG (calculated by the climate
module of TIAM) are provided to GENIE, which then calculates the
impacts of the technical and economic changes on climate.
Macro-Economic Assumptions
Table 1 shows the evolution of GDP over the period 2010-2100. The growth of world GDP would suffer a continual slowdown to 0.9% per year by the end of the 21st century. Developed countries would face growth rates below 2% in the first part of the 21st century because of an aging population and low productivity rates. By the end of the 21st century, the growth rate of developed countries is around 0.6% per year. In developing countries the beginning of this century would be characterized by greater heterogeneity. The Asian region, particularly China and India, continue to have sustained growth until a slow down towards the end of the century. There would be more modest growth in developing countries, including all of Asia, towards the end of the century.

Overall,
these growth assumptions have been used by several groups of modelers
in the European Framework Program (FP7) projects such as PLANETS.
Table 2 shows the trend of economic growth over the period 2010-2030 for Europe based on the results of GEMINI-E3 model.

Energy Prices
The price of oil on the international markets reaches almost 100$/bbl in 2030, and 140 $/bbl by the end of the century. In addition to considering the characteristics of reserves and extraction dynamics, the reference case considers a profit-maximizing strategy for OPEC regions which reduce their production to 80% of the production that would be obtained in perfect global equilibrium. This rate was defined by some focused TIAM analyses that addressed the strategic behaviour of OPEC regions (Loulou et al., 2009). The gas market is more or less divided into three: the American market, the European-African-Russian market and the Asian market. However, the development of liquefied natural gas tends to reduce the distinctions between these three markets. Gas prices tend to follow the increase of oil price, while Europe, closer to the African and Russian suppliers, benefits from a slightly lower price than the rest of the World. Coal remains cheap throughout the time horizon as a result of abundant and widely distributed resources.

Primary energy and final-use consumptions
The World energy system is dominated by fossil fuels, especially coal as a result of relatively high oil prices. Coal is used mainly for electricity generation and industrial activities but also for synthetic fuel production from the mid-century. Synthetic fuels contribute to the decrease of primary oil energy consumption, while the consumption of oil (including synthetic fuels) by the end-use sectors does not decrease. The increase of the consumption of biomass and bio-fuels is also motivated by the demands of industry (biomass) and transport activities (bio-ethanol, bio-diesel). The share of electricity in final energy consumption is slightly increased, illustrating a trend to electrification of the energy system.


Power Plants
Electricity generation is increased by a factor of almost 3.5 between 2005 and 2100. The relative share of fossil fuels decreases (from 67% to 40% of total electricity generated) compensated by the increase of nuclear (from 15% to 24%) and renewables (from 17% to 35%, including biomass). Amongst the sources of renewable energy, hydro remains dominant, but wind notably penetrates the market, especially in developing countries. It is worth emphasising that nuclear-based electricity generation is lower and upper bounded in TIAM, as the number of installed nuclear plants depends not only on techno-economic factors but also on social-political factors (acceptability, availability of capital, etc.) that are not directly represented in TIAM.

GHG Emissions
Global GHG emissions (CO2, CH4 and N2O) increase steadily during the century to reach 25 Gigatons of carbon in 2100 (20 GtC of CO2 only). Developed countries' emissions increase modestly until the mid-21st century and then stabilize at around 6 Gigatons of carbon. Emissions
from Asia grew most strongly over the period and would be multiplied by
three, representing half of global emissions at the end of the century. Within this area, China would represent 60% of emissions. Russia would also face a major development of its emission followed by the Middle East. Africa and Central and Latin America would increase 70%.
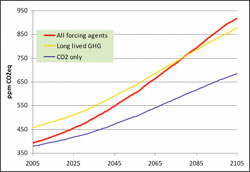
The atmospheric concentration of CO2 resulting from these emissions reached 650 ppm at the end of the horizon.
Energy and Technology decisions and energy service growth demands are the factors underlying these emission trajectories.


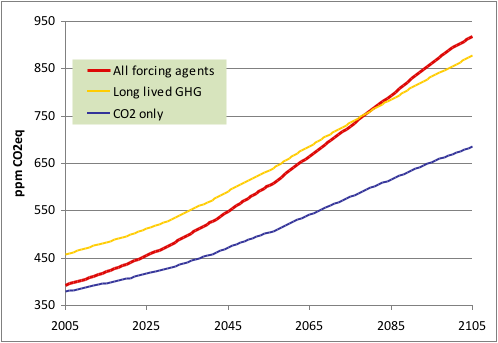

Emissions by sector show the high contribution of the industry and electricity sectors to global emissions, and the especially high increase of the industry and upstream sectors (the latter mainly because of the growth of the production of synthetic fuels), while the emissions of the other sectors remain almost constant, thanks to increased efficiency, the trend to electrification of these sectors or the use of bio-fuels.
NOTE : The total emissions in C-eq do not match those of previous graphs (non CO2 emissions are missing)

Climate
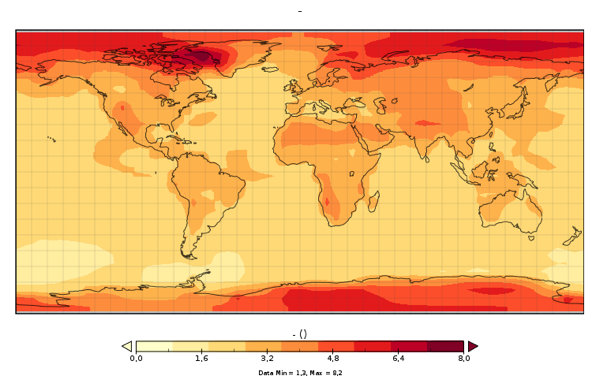
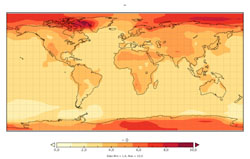
GENIE shows a familiar pattern of global warming, similar to that seen in many previous simulations and presented by the IPCC. Warming at around 2100 is concentrated over land, owing largely to the thermal inertia of oceans, and the positive feedback effects of snow melt. Increased warming in high-latitude regions is also a widely-reported prediction.
The Global warming in the reference scenario is equal to 3.55 degrees relative to pre-industrial.
Note that temperature increase in all the GENIE results (below) is measured
relative to 2005. Temperature increase relative to pre-industrial is 0.76C greater
than shown.
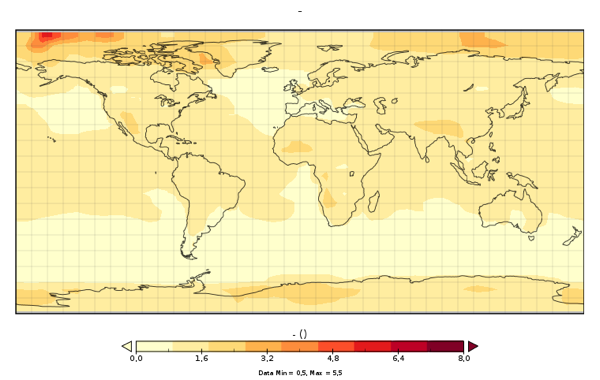
Predicted uncertainties are larger in
GENIE-2 than in GENIE-1, owing to the more complex and thus more uncertain
dynamics of GENIE-2. Although in principle our method accounts for all sources
of uncertainty, practically it is impossible to quantify ‘unknown unknowns' and
the divergence of predictions between complex models, particularly for regional
change, is generally larger than simple models would predict (Crucifix 2006
Geophysical Res. Letters). Thus we expect the larger uncertainties found in
GENIE-2 (standard deviation around 1~2C over land for the baseline scenario) to
be more representative of actual uncertainty.
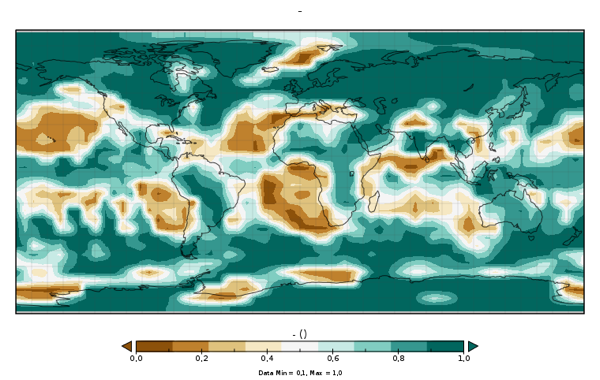
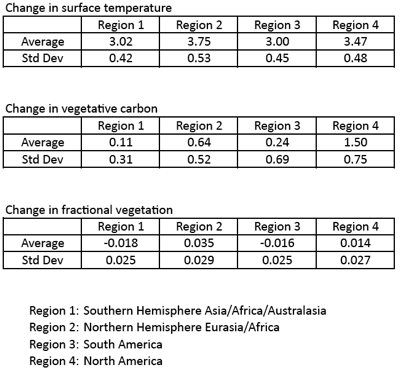
Note that the change in vegetation carbon
at 2105 is of uncertain sign, again this agrees with more complex model predictions
(Friedlingstein et al. 2006 J. Climate). The sign change is likely to be driven
by increased low-latitude respiration rates (largely from increased decomposition) and moisture
stress, compensating the CO2 fertilization effect and the temperature response
of photosynthesis.

