Scenario 6: CPH Failure
Context
The scenario represents the
failure of the negotiations about the long-term commitments: countries comply with
their less strict pledge announcements until 2030, and stop any other emission
reduction after 2020. This scenario represents a sort of threat scenario,
illustrating what could happen if no long-term agreement is reached apart from
the current Copenhagen Accord.
Trade of carbon permits occurs during the
years of the Copenhagen Accord. In TIAM, it is limited to 10% in 2020 and 20% in
2030 of the required emission reduction of each country, including
the voluntary emission reductions.
Climate
Please note that results below from GENIE are relative to 2005. In average, the temperature change relative to pre-industrial is 0.76 degrees higher.
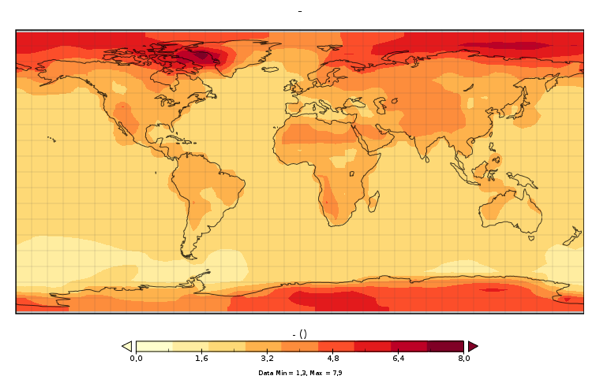
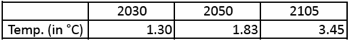
+ SAT warming average in 2105 relative to 2005
+ SAT warming standard deviation in 2105 relative to 2005
+ SAT warming average in 2050 relative to 2005
+ SAT warming average in 2030 relative to 2005
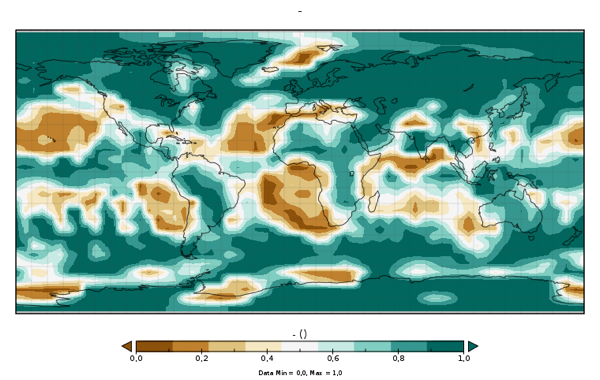
+ Probability of a precipitation increase (in %)
Techno-economy analysis (long term)
The long-term energy system
of the different countries doesn't differ from the energy system of the
reference: some effects of short-term mitigation efforts on the energy system
remain visible during around 10 years after the end of the climate agreement
(for example, higher generation of wind-based electricity to substitute
coal-based electricity), but they disappear in the longer term. The measures implemented under the
Copenhagen Accord are not deep enough to modify the energy system forever. Such
a conclusion could be of course different in case of deeper emission cuts in
the first part of the century, permitting for example the penetration of new
technologies in a sufficient volume to provoke a decrease of their cost and
make them cost-efficient even without any climate constraint.
Despite the return to an
energy system similar to the reference, long-term net emissions result to be
slightly smaller (5 to 7% smaller) than the emissions of the reference case
because of the long-term impacts of forestry measures: by default in TIAM, plantations decided
in the first part of the century last during several decades given the lifetime
of trees. The reality could be of course different if the countries have no
incentive anymore to manage in a sustainable manner their forests.
+ Cost of the strategy: Net present value (NPV) of the cost of the strategy given as a % of the NPV of the GDP cumulated over the century: 0.055%
Emissions
+ Emissions of CO2, CH4 and N2O in GtC until 2105
Energy / Technology
+ Cumulative sequestrated carbon in geological sinks: 4 GtC
+ Primary energy (assuming FEQ=1 for non fossil energy) in EJ
+ Electricity generation in billions of kWh
+ Energy consumption by end-use sectors, including non-energy purposes in EJ