Scenario 12: First-Best 2°C
Context
The First-Best scenario represents a benchmark scenario: it illustrates the socially optimal solution for the World to limit the long term temperature increase below 2°C. Mitigation options are implemented when and where they are most cost-efficient at the World level and over the entire time horizon. This scenario is used mainly for comparison purpose with the unique second-best scenario able to limit the long-term temperature increase to 2°C (scenario n°13: CPH Plus 2°C).
Climate
Please note that results below from GENIE are relative to 2005. In average, the temperature change relative to pre-industrial is 0.76 degrees higher.
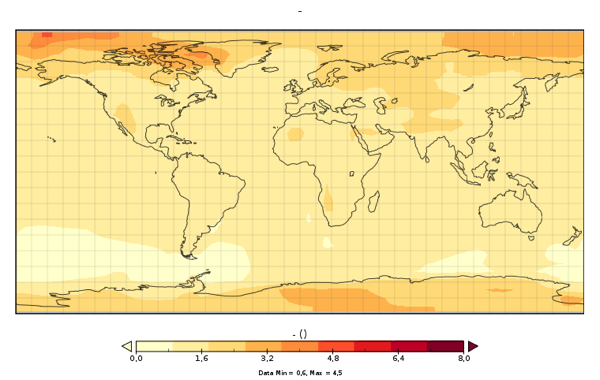
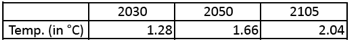
+ SAT warming average in 2105 relative to 2005
+ SAT warming standard deviation in 2105 relative to 2005
+ SAT warming average in 2050 relative to 2005
+ SAT warming average in 2030 relative to 2005
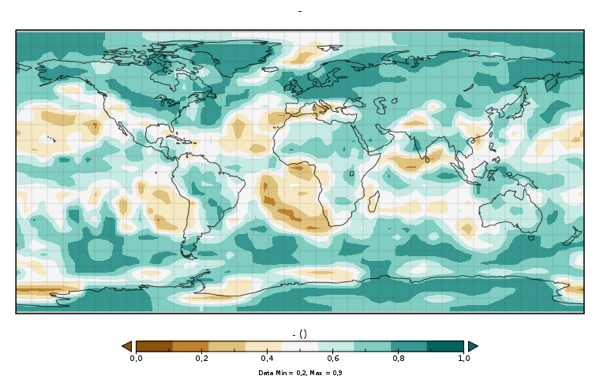
+ Probability of a precipitation increase (in %)
Techno-economy analysis (long term)
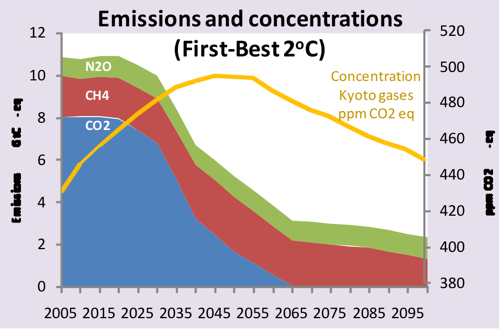
Even in the most optimistic climate treaty (socially optimal solution), reaching the long term 2°C target is difficult: GHG concentration peaks around 2045, the system becomes CO2-free by 2065, there is a large electrification of the energy system, and the electricity is almost fully decarbonized by 2050. Renewable energy supplies about 60% of electricity generation by 2050 and 75% by 2100, and all renewable energy forms are important in the energy portfolio. Common with the results recognized by many models, negative emissions generated by biomass power plants and biorefineries with CCS play a crucial role in order to compensate for captive fossil fuel uses (mainly in industry and transport) but also for non-energy emissions, mainly from agriculture. CO2 price reaches up to 900$2000/tCO2 at the end of the horizon.
+ Cost of the strategy: Net present value (NPV) of the cost of the strategy given as a % of the NPV of the GDP cumulated over the century: 1.76%
Emissions
+ Emissions of CO2, CH4 and N2O in GtC until 2105
Energy / Technology
+ Cumulative sequestrated carbon in geological sinks: 409 GtC
+ Primary energy (assuming FEQ=1 for non fossil energy) in EJ
+ Electricity generation in billions of kWh
+ Energy consumption by end-use sectors, including non-energy purposes in EJ