Scenario 10: CPH Plus
Context
The scenario aims to represent a simple version of the proposal made by the G8 for a deep cut of emissions in industrialized countries and a serious reduction in the rest of the World: after the Copenhagen Accord, deeper reductions are implemented (-80% wrt 1990 in Annex 1 regions, - 50% wrt Reference in other regions).
Climate
Please note that results below from GENIE are relative to 2005. In average, the temperature change relative to pre-industrial is 0.76 degrees higher.
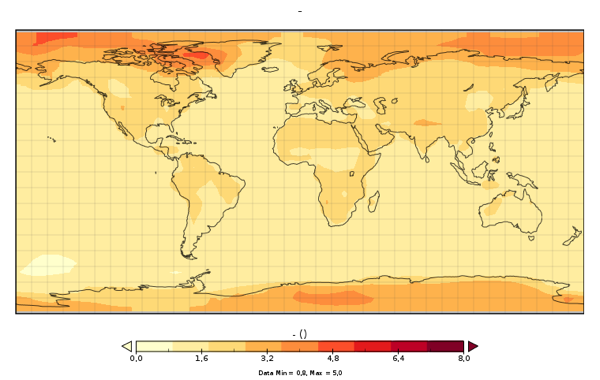
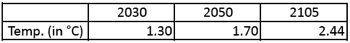
+ SAT warming average in 2105 relative to 2005
+ SAT warming standard deviation in 2105 relative to 2005
+ SAT warming average in 2050 relative to 2005
+ SAT warming average in 2030 relative to 2005
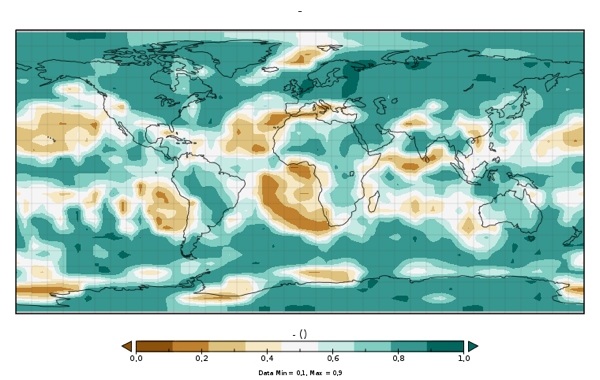
+ Probability of a precipitation increase (in %)
Techno-economy analysis (long term)
The 2050 targets correspond to a reduction of emission by 15% in 2030 and 43% in 2050 with respect to 2005, obviously higher than the lower and higher pledges of the Copenhagen Accord. CO2 prices vary amongst countries from 50 to 900 $2000/tCO2 at the end of the century, the highest price being observed in Middle East and Japan (apart from these two countries, CO2 price reached 340 $2000/tCO2 in many countries (Europe, China, USA, Russia, etc.). CO2 prices reflect the difficulty in complying with the targets imposed to regions, given the expected increase of emissions in these countries, the available mitigation options and the limited trade of permits allowed between countries.
Not surprisingly, the more severe 2050 targets provoke deeper changes in the energy system:
- Solar, wind, and biomass with CCS play a much higher role in electricity generation; coal with CCS also plays a higher role but only as a transition measure until solar and biomass with CCS take a higher share of the market.
- In the end-use sectors, the substitution of coal consumed in industry by natural gas is higher, while electricity increases its share mainly in buildings, replacing gas transferred to the industry sector.
- In transport, the penetration of hydrogen and electricity is accelerated, preferred to gas which was used as a mitigation option in less severe scenarios. Biofuels are not used as a mitigation option, the use of biomass for other energy purposes being preferred.
- In other words, some electrification of the energy system is observed in this case (consumption of electricity increases by up to 13% compared to the Reference case).
+ Combination with a long-term climate target: In order to evaluate if the implementation of stricter targets, as motivated by deep 2050 cuts of emissions and applied after the 2020 pledges of the Copenhagen Accord, is enough to keep the long term temperature increase below 2°C, it is assumed that an international treaty involving the perfect cooperation of all countries is found and applied from 2055: all countries cooperate and mitigation efforts are done where they are more efficient. In other words, a first-best policy is applied from 2055. In this case, the 2°C target is feasible, given the mitigation options available in the model. Results are presented in scenario n°13: CPH Plus 2°C.
+ Cost of the strategy: Net present value (NPV) of the cost of the strategy given as a % of the NPV of the GDP cumulated over the century: 0.915%
Emissions
+ Emissions of CO2, CH4 and N2O in GtC until 2105
Energy / Technology
+ Cumulative sequestrated carbon in geological sinks: 413 GtC
+ Primary energy (assuming FEQ=1 for non fossil energy) in EJ
+ Electricity generation in billions of kWh
+ Energy consumption by end-use sectors, including non-energy purposes in EJ