Scenario 8: CPH Low Forever
Context
The scenario
represents the "light" version of the Copenhagen Accord, based on the less
strict pledges proposed by the countries. For example, EU reduces its emissions
only by 20% compared to 1990. These pledges are assumed to be maintained
forever.
In TIAM, trade of carbon permits is limited to 10% in 2020 and 20% from
2030, of the required emission reduction of each country, including the
voluntary emission reductions.
Climate
Please note that results below from GENIE are relative to 2005. In average, the temperature change relative to pre-industrial is 0.76 degrees higher.
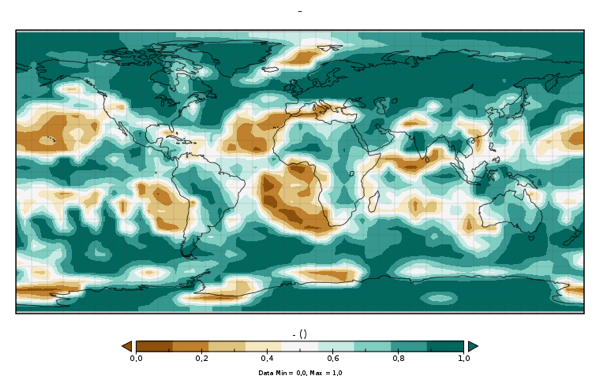
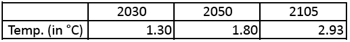
+ SAT warming average in 2105 relative to 2005
+ SAT warming standard deviation in 2105 relative to 2005
+ SAT warming average in 2050 relative to 2005
+ SAT warming average in 2030 relative to 2005
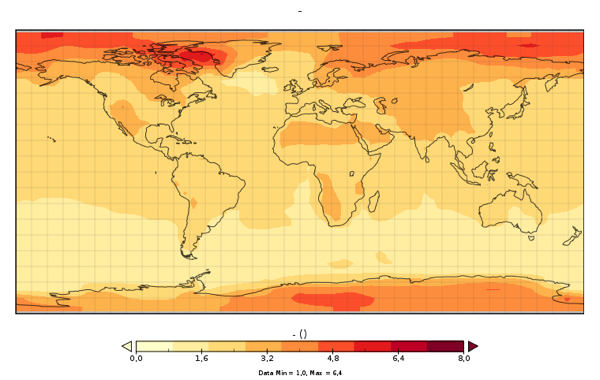
+ Probability of a precipitation increase (in %)
Techno-economy analysis (long term)
This scenario, as
well as scenario 9: CPH High Forever, aim to emphasize the consequences of the pledges
of the Copenhagen Accord, assuming they are maintained over the century. The
combination of these scenarios with long-term climate targets, as described
below, completes the analysis by evaluating if these pledges keep the door open
for deeper emission cuts so that the long-term temperature increase remains
below 2°C.
The lower pledges don't result in an absolute reduction of CO2 emissions
but in a slowing of the increase (around 15% of 2005 emissions compared to an
increase of up to 170% in the Reference case). CO2 prices vary amongst
countries from 50 to 240 $2000/tCO2 at the end of the
century; it is higher in emerging regions like China, India, Middle East,
Mexico, reflecting the difficulty in complying with the targets imposed to
these regions, given the expected increase of emissions in these countries, the
available mitigation options and the limited trade of permits allowed between
countries.
The main changes of the energy system are the following ones:
- Substitution of conventional coal plants for electricity generation by renewable (wind, solar as well as biomass with carbon capture and sequestration CCS) and by plants with CCS (fuelled with coal and gas, and biomass); let's remind that power plants fuelled by biomass and equipped with CCS result in negative emissions.
- Substitution of coal in the end-use sectors (mainly consumed by the industry sector) by less emitting fuels, mainly gas; also, the direct use of biomass is preferred to its transformation in biofuels.
- Gas, hydrogen and electricity substitute up to 20% of the fossil oil consumed in transport, while the use of biofuels decreases, biomass being preferred for other uses.
- Unchanged consumption of electricity; in other words, the pledges don't result in an electrification of the end-uses.
+ Combination with a long-term climate target: In order to evaluate what must be done after 2030 to keep the long term temperature increase below 2°C, it is assumed that these pledges as proposed by the Copenhagen Accord remain until 2040, without anticipation by the countries of more strict targets in the long term. Then, an international treaty involving the perfect cooperation of all countries is found and applied from 2040: all countries cooperate and mitigation efforts are done where they are more efficient. In other words, a first-best policy is applied from 2040. In this case, the 2°C cannot be respected, given the mitigation options available in the model. The smallest feasible temperature increase would be around 2.15-2.20°C. In other words, the Copenhagen Accord must be immediately followed by deeper reductions in order to succeed in limiting the long-term temperature to 2°C. The same conclusion is obtained with the strictest pledges of the Copenhagen Accord.
+ Cost of the strategy: Net present value (NPV) of the cost of the strategy given as a % of the NPV of the GDP cumulated over the century: 0.309%
Emissions
+ Emissions of CO2, CH4 and N2O in GtC until 2105
Energy / Technology
+ Cumulative sequestrated carbon in geological sinks: 248 GtC
+ Primary energy (assuming FEQ=1 for non fossil energy) in EJ
+ Electricity generation in billions of kWh
+ Energy consumption by end-use sectors, including non-energy purposes in EJ