Scenario 13: CPH Plus 2°C
Context
This second-best scenario is the only one able to keep the long-term temperature increase below 2°C. It assumes the implementation of the 2020 pledges of the Copenhagen Accord, immediately followed by deeper emission reductions until 2050, and finally, the implementation of an international treaty involving the perfect cooperation of all countries from 2055: all countries cooperate and mitigation efforts are done where they are more efficient. In other words, a first-best policy is applied from 2055.
Climate
Please note that results below from GENIE are relative to 2005. In average, the temperature change relative to pre-industrial is 0.76 degrees higher.
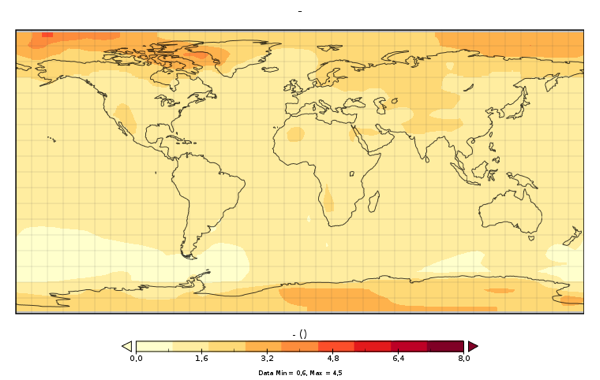
+ SAT warming average in 2105 relative to 2005
+ SAT warming standard deviation in 2105 relative to 2005
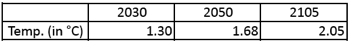
+ SAT warming average in 2050 relative to 2005
+ SAT warming average in 2030 relative to 2005
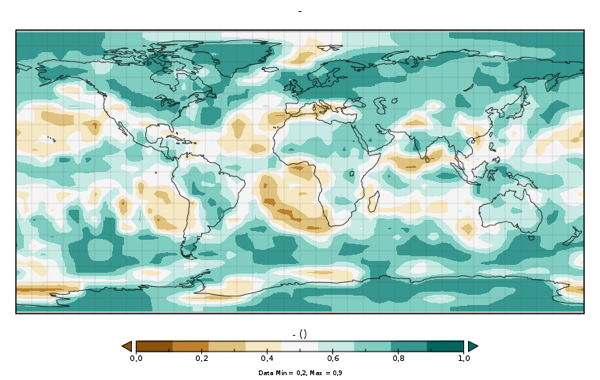
+ Probability of a precipitation increase (in %)
Techno-economy analysis (long term)
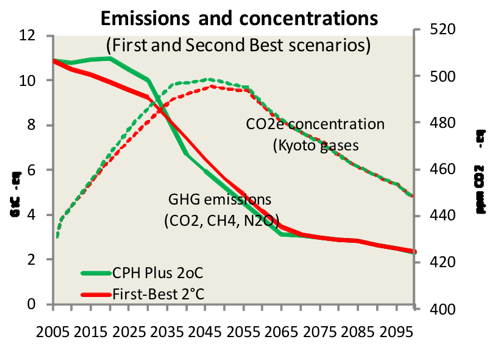
One interest of this scenario is compare it with the First-Best strategy (scenario 12: First-Best 2° C) and evaluate the impacts of the "deviation" from the First-Best scenario, where full cooperation would start in as soon as 2012. An accelerated decarbonization of the energy system is observed around 2040-2060 to compensate for the higher emissions during the first part of the century. This accelerated decarbonisation corresponds, amongst other, to a higher role of renewable and gas power plants with CCS during this period, compared to the First-Best 2°C scenario, as well as a higher substitution of coal by gas in end-use sectors. The carbon price reaches 380$2000/tCO2 in 2050 instead of 320$2000/tCO2 in the First-Best scenario, almost 900$2000/tCO2 in 2065 compared to 750$2000/tCO2 in the First-Best scenario, while longer-term prices are slightly smaller than in the First-Best scenario, illustrating the highest efforts required in the intermediate periods.
+ Cost of the strategy: Net present value (NPV) of the cost of the strategy given as a % of the NPV of the GDP cumulated over the century: 1.82%
Emissions
+ Emissions of CO2, CH4 and N2O in GtC until 2105
Energy / Technology
+ Cumulative sequestrated carbon in geological sinks: 417 GtC
+ Primary energy (assuming FEQ=1 for non fossil energy) in EJ
+ Electricity generation in billions of kWh
+ Energy consumption by end-use sectors, including non-energy purposes in EJ